


This article is part of our Collette Calls series.
2020 was unique in so many ways, and maybe none more so than we nearly saw more wins being assigned to relief pitchers than starting pitchers. Things normalized the final few weeks, but for the first four to five weeks, relievers had the lead. By season's end, it was a 52/48 split at a time the league had never seen fewer than 60 percent of wins going to starting pitchers. This season has seen a resumption of the trend prior to 2020 with 58 percent of wins going to starting pitchers:
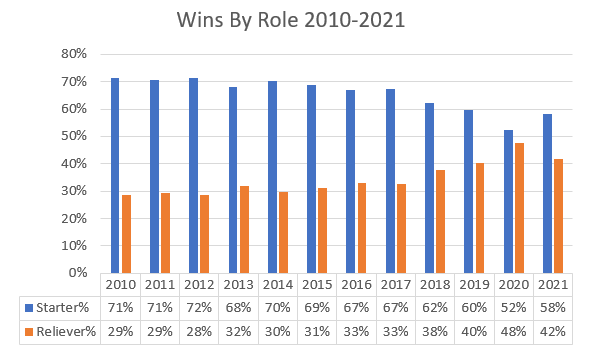
We may have become a bit spoiled in fantasy baseball by the vulture win last season given how many went to relievers as managers piecemealed pitching staffs together. The injury bug has stuck around in 2021 as we are still seeing the second-highest percentage of wins going to relievers, though the number is more in line with the rate we began to see in 2017 as The Opener* made its debut in the sport. What began out of necessity when Tampa Bay saw four starting pitchers on the big league staff become injured, along with three Triple-A pitchers, has now become a more common strategy. Some teams currently implement a Johnny Bullpen day due to injury while others could not find six effective healthy pitchers and decided an eight-man bullpen could do a heavy lift one time through a rotation each cycle.
Each season, we have relief pitchers who were either end-game material, reserve material or even undrafted sneak
2020 was unique in so many ways, and maybe none more so than we nearly saw more wins being assigned to relief pitchers than starting pitchers. Things normalized the final few weeks, but for the first four to five weeks, relievers had the lead. By season's end, it was a 52/48 split at a time the league had never seen fewer than 60 percent of wins going to starting pitchers. This season has seen a resumption of the trend prior to 2020 with 58 percent of wins going to starting pitchers:
We may have become a bit spoiled in fantasy baseball by the vulture win last season given how many went to relievers as managers piecemealed pitching staffs together. The injury bug has stuck around in 2021 as we are still seeing the second-highest percentage of wins going to relievers, though the number is more in line with the rate we began to see in 2017 as The Opener* made its debut in the sport. What began out of necessity when Tampa Bay saw four starting pitchers on the big league staff become injured, along with three Triple-A pitchers, has now become a more common strategy. Some teams currently implement a Johnny Bullpen day due to injury while others could not find six effective healthy pitchers and decided an eight-man bullpen could do a heavy lift one time through a rotation each cycle.
Each season, we have relief pitchers who were either end-game material, reserve material or even undrafted sneak up and have productive seasons for wins out of a relief role. However, it does not happen as frequently as it once did. During the wild-card era (1995-present), we have twice witnessed five pitchers win at least 10 games while working fewer than 100 innings in a season with at least 80 percent of their innings coming out of relief:
- 1997: Bobby Ayala, Roberto Hernandez, T.J. Mathews, Danny Patterson, Arthur Rhodes
- 1999: Dennis Cook, Steve Karsay, Mark Petkovsek, Mike Remlinger, Scott Williamson
However, since the end of the 1999 season, there are just three seasons in which three or more pitchers pulled off a 10-win season in a relief role:
| Season | #Matching | Pitchers |
|---|---|---|
| 2000 | 4 | Danny Graves / Shigetoshi Hasegawa / Jim Mecir / Gabe White |
| 2001 | 1 | Paul Quantrill |
| 2002 | 3 | Tony Fiore / Billy Koch / Arthur Rhodes |
| 2003 | 3 | Luis Ayala / Joe Nathan / Oscar Villarreal |
| 2004 | 2 | Todd Jones / Juan Rincon |
| 2005 | 2 | Jesse Crain / Scot Shields |
| 2006 | 1 | Francisco Cordero |
| 2007 | 0 | |
| 2008 | 1 | Jose Arredondo |
| 2009 | 1 | Alfredo Aceves |
| 2010 | 1 | Tyler Clippard |
| 2011 | 1 | Matt Belisle |
| 2012 | 0 | |
| 2013 | 0 | |
| 2014 | 2 | Mike Dunn / Tony Watson |
| 2015 | 0 | |
| 2016 | 2 | Brad Brach / Andrew Miller |
| 2017 | 0 | |
| 2018 | 0 | |
| 2019 | 2 | John Gant / Brandon Workman |
I raise this issue now because we're roughly 25 percent into the 2021 season, yet we have 28 relievers with three or more wins, while six already have four or more wins paced by the unicorn that is Yusmeiro Petit:
Player | Tm | Lg | Wins | IP | G | GF | L | SV | Dec | Dec% |
|---|---|---|---|---|---|---|---|---|---|---|
OAK | AL | 6 | 26 | 24 | 4 | 0 | 1 | 7 | 29% | |
TBR | AL | 5 | 23 | 17 | 3 | 0 | 2 | 7 | 41% | |
TEX | AL | 5 | 24 | 17 | 4 | 3 | 0 | 8 | 47% | |
NYY | AL | 4 | 19 | 19 | 15 | 0 | 11 | 15 | 79% | |
TBR | AL | 4 | 21.2 | 20 | 5 | 1 | 2 | 7 | 35% | |
PHI | NL | 4 | 18 | 19 | 1 | 1 | 0 | 5 | 26% |
Petit has amassed six wins in just 26 innings this year, putting him on pace to shatter the record set by Mike Dunn in 2014 when Dunn won 10 games in just 57 innings. He is even on pace to exceed the 12 wins most recently done by Jesse Crain in 2005 in 79 innings of relief. While most of his appearances have not involved a decision, he has made the most of his limited work given Bob Melvin only uses him in medium or high-leverage situations. Petit does not open games and is rarely seen before the seventh inning, allowing him to be leveraged in the right situations. That said, he is on an improbable pace for wins, which should be considered as you look at your own team's win total and how much the rubber-armed reliever is contributing to your overall total.
The earlier table reminds us that in recent seasons, 0-2 pitchers have earned 10 wins in a relief role. This season, we have six relievers easily on pace to do so. The far-right column in the table above shows how many outings that pitcher has earned a decision in along with the percentage of outings where the pitcher had a win, loss or a save. Chapman has been the most productive reliever with 15 decisions in 19 outings, which is not too far off some previous seasons as he has thrice earned decisions in more than 70 percent of his games (2012, 2014, 2019.) Conversely, Brogdon was productive early out of the gate with three quick wins yet has cooled off since.
It is not surprising to see Tampa Bay put two relievers on this list given three of the four arms they brought in to replace the workloads from Blake Snell and Charlie Morton have each already spent time on the injured list. Of Michael Wacha, Chris Archer, Collin McHugh and Rich Hill, only the ageless lefty has avoided the injury list while the club has cycled through some other options and has had an offense that has done well late in games. King may continue his role in Texas with the club struggling to field healthy pitchers, as Kyle Gibson hit the IL during the writing of this piece, which could force the club into its own creative pitching planning.
FanGraphs has a stat on their leaderboard labeled inLI that measures the pitcher's average Leverage Index at the start of each inning in which they work. Leverage Index works like many other indexed stats in that 1.0 is average. Leverage Index is considered low when it is 0.0-0.85, medium when it is between 0.85 and 2.0, and high is obviously above that. Pitchers need a lot to go right to get a win while pitching in low leverage because that would mean the offense came in and hung a large crooked number. If we revisit the above table and insert each pitcher's inLI, we see a good indicator:
Player | Tm | inLI | Wins | IP | G | GF | L | SV | Dec | Dec% |
|---|---|---|---|---|---|---|---|---|---|---|
OAK | 1.39 | 6 | 26 | 24 | 4 | 0 | 1 | 7 | 29% | |
TBR | 1.35 | 5 | 23 | 17 | 3 | 0 | 2 | 7 | 41% | |
TEX | 1.15 | 5 | 24 | 17 | 4 | 3 | 0 | 8 | 47% | |
NYY | 1.84 | 4 | 19 | 19 | 15 | 0 | 11 | 15 | 79% | |
TBR | 1.47 | 4 | 21.2 | 20 | 5 | 1 | 2 | 7 | 35% | |
PHI | 1.12 | 4 | 18 | 19 | 1 | 1 | 0 | 5 | 26% |
Chapman blows the curve for the rest of the group because his multiple ninth-inning appearances, but Petit, Kittredge and Springs are in a solid band of leverage compared to the likes of King and Brogdon, who are closer to the lower end of the spectrum. Some current non-closers who have favorable usage by Leverage Index include the names below:
Name | Team | W | inLI |
|---|---|---|---|
WSN | 3 | 1.32 | |
TBR | 3 | 1.70 | |
NYY | 3 | 1.54 | |
PHI | 3 | 1.46 | |
CIN | 3 | 1.64 |
Remember, 80 percent of success is showing up. The first group of six has taken full advantage of their appearances while the above group of five may have some more upside left in them for wins. Hudson may be the most valuable of the quintet given Brad Hand's issues lately.