


This article is part of our Rounding Third series.
Last week we discussed Hitting Category Targets, this week we'll turn our attention to the pitchers. But before delving into the pitching results, I wanted to demonstrate how easy it is to set your targets and track your progress during your draft using the RotoWire draft tool.
Here's our home page of the draft software, at the conclusion of the LABR Mixed League draft:
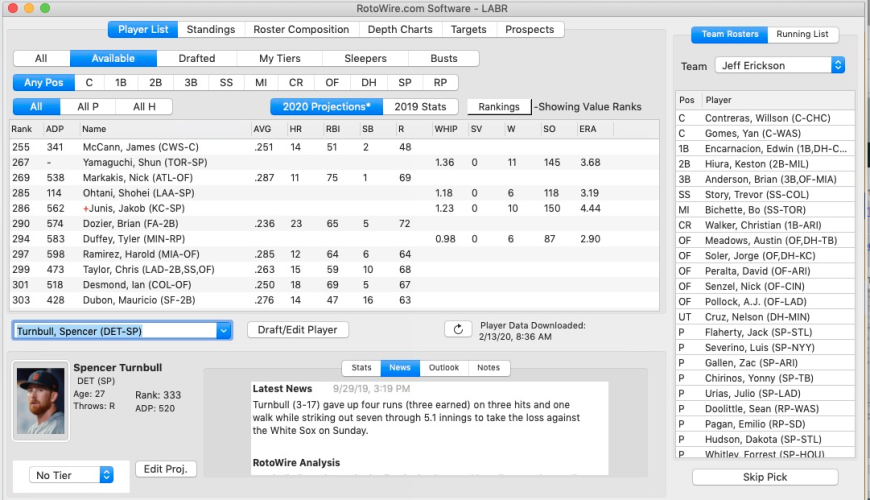
At the top of the page, you can see six options, including the "Player List" currently showing, and the "Targets" list second from the right.
And here's the Targets page — and I filled in targets on the hitting side.
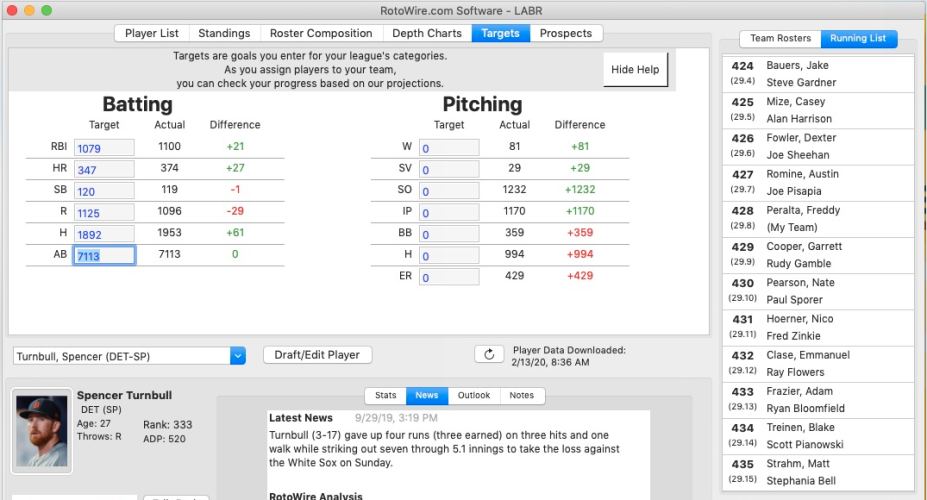
I'm pretty happy with most of the hitting results — I still need a little more speed, and have some work to do in the runs category, if my projections are solid.
Use those targets wisely, though. Know the composition of your roster when looking at what your draft has given you so far. For instance, if you drafted Trea Turner and Mallex Smith, and they account for nearly all of your projected stolen bases at that point, you might not be as close to your goal as you might think. Either an injury or a demotion could wreck your progress, and you have fewer paths to your target.
That's a necessary evil when it comes to saves, unfortunately — only one player can notch a save in a game, and often nobody gets a save in a game. So our volatility in that
Last week we discussed Hitting Category Targets, this week we'll turn our attention to the pitchers. But before delving into the pitching results, I wanted to demonstrate how easy it is to set your targets and track your progress during your draft using the RotoWire draft tool.
Here's our home page of the draft software, at the conclusion of the LABR Mixed League draft:
At the top of the page, you can see six options, including the "Player List" currently showing, and the "Targets" list second from the right.
And here's the Targets page — and I filled in targets on the hitting side.
I'm pretty happy with most of the hitting results — I still need a little more speed, and have some work to do in the runs category, if my projections are solid.
Use those targets wisely, though. Know the composition of your roster when looking at what your draft has given you so far. For instance, if you drafted Trea Turner and Mallex Smith, and they account for nearly all of your projected stolen bases at that point, you might not be as close to your goal as you might think. Either an injury or a demotion could wreck your progress, and you have fewer paths to your target.
That's a necessary evil when it comes to saves, unfortunately — only one player can notch a save in a game, and often nobody gets a save in a game. So our volatility in that category can be higher than in other categories.
ERA
| OC-2019 | OC-2018 | ME-2019 | ME-2018 | TGFBI-2019 | TGFBI-2018 | |
|---|---|---|---|---|---|---|
| 80% | 3.745 | 3.469 | 3.845 | 3.566 | 3.807 | 3.56 |
| 70% | 3.838 | 3.562 | 3.957 | 3.686 | 3.906 | 3.65 |
| 50% | 3.997 | 3.730 | 4.114 | 3.829 | 4.063 | 3.83 |
| 20% | 4.247 | 3.993 | 4.363 | 4.086 | 4.324 | 4.13 |
* OC = RotoWire Online Championship
* ME = NFBC Main Event
* TGFBI = The Great Fantasy Baseball Invitational
Here you can see the havoc wreaked upon pitchers in 2019 by the juiced ball. The league average ERA across all MLB pitchers was 4.47, a big jump from 2018 (4.12) and even 2017 (4.31). What's striking, however, is many previous seasons had higher ERAs, tied both to expansion and the steroid era, even though the home run rates didn't come close to matching last year's gargantuan total.
WHIP
| OC-2019 | OC-2018 | ME-2019 | ME-2018 | TGFBI-2019 | TGFBI-2018 | |
|---|---|---|---|---|---|---|
| 80% | 1.180 | 1.166 | 1.202 | 1.184 | 1.200 | 1.18 |
| 70% | 1.199 | 1.183 | 1.223 | 1.201 | 1.217 | 1.20 |
| 50% | 1.230 | 1.214 | 1.254 | 1.216 | 1.243 | 1.23 |
| 20% | 1.280 | 1.263 | 1.298 | 1.277 | 1.292 | 1.29 |
While ERAs climbed dramatically last year, the rate that WHIP increased in our game (and across baseball) was not nearly as steep. And if you look at the components of WHIP, it's easy to understand why. Hits allowed increased from 8.45 per team per game to 8.65, and walks only moved from 3.23 to 3.27. The various shifts employed in baseball take away many hits, but more important, as we'll see in the next segments, nothing has abated the increase in strikeouts for more than a decade. From 1993 to 2009, teams allowed more than nine hits per game every single year, but they haven't reached that figure once since then.
STRIKEOUTS
| OC-2019 | OC-2018 | ME-2019 | ME-2018 | TGFBI-2019 | TGFBI-2018 | |
|---|---|---|---|---|---|---|
| 80% | 1525 | 1480 | 1476 | 1444 | 1428 | 1373 |
| 70% | 1482 | 1442 | 1440 | 1401 | 1381 | 1339 |
| 50% | 1415 | 1377 | 1377 | 1337 | 1307 | 1260 |
| 20% | 1294 | 1245 | 1263 | 1238 | 1178 | 1157 |
There's no bigger disconnect in the game between generations than the volume of strikeouts. Strikeouts have increased in the game every year since 2005, when there was an average of 6.30 strikeouts per team per game, through last year, when that number spiked to an all-time high of 8.81. The 12 highest strikeout seasons per game have been the last 12 seasons, in reverse order from last year no less.
That puts a tremendous amount of pressure on us to get strikeouts. If we want to get to the 80th percentile in strikeouts in 12-team leagues, assuming that this pace only continues, we need at least 169 strikeouts per pitching slot.
WINS
| OC-2019 | OC-2018 | ME-2019 | ME-2018 | TGFBI-2019 | TGFBI-2018 | |
|---|---|---|---|---|---|---|
| 80% | 96 | 96 | 94 | 93 | 90 | 89 |
| 70% | 93 | 92 | 91 | 90 | 85 | 84 |
| 50% | 86 | 85 | 85 | 84 | 79 | 79 |
| 20% | 76 | 74 | 74 | 75 | 70 | 66 |
You would think that with pitchers giving up more runs, throwing fewer innings overall (in 2015 there were 25 pitchers who threw at least 200 innings, but that dropped to only 13 last year), our totals needed in wins would drop. But that wasn't the case — instead they stayed mostly stable, or even climbed in a few cases. One thing that remained a constant, and is still a surprise to me, is that the totals needed for each threshold in the 15-team Main Event remained higher than the 15-team TGFBI.
SAVES
| OC-2019 | OC-2018 | ME-2019 | ME-2018 | TGFBI-2019 | TGFBI-2018 | |
|---|---|---|---|---|---|---|
| 80% | 82 | 88 | 73 | 79 | 75 | 80 |
| 70% | 77 | 82 | 67 | 73 | 69 | 73 |
| 50% | 66 | 71 | 57 | 63 | 57 | 62 |
| 20% | 45 | 50 | 38 | 40 | 38 | 37 |
Saves are disappearing at an epidemic-like pace, at least in fantasy leagues, if not across the major leagues. There were 1,180 saves in MLB last year, 64 fewer than the year before, but one more than in 2017. But they are being dispersed to more relievers on a rapidly accelerating basis. This chart only goes halfway to demonstrating the dwindling numbers we need in this category — from 2012-2016, our 70th and 80th percentiles in the 15-team Main Event were 82 and 88, respectively. Fifteen saves gone, poof, just like magic!
Clearly, the way bullpens are managed goes a long way toward explaining this dynamic. More teams are comfortable with relief aces pitching in the seventh and eighth innings, if the manager deems that to be the most crucial situation. And it's not just rebuilding teams that are innovating, but also some of the elite teams. The Rays had 10 pitchers record a save in 2019. The Red Sox might have been "forced" to eschew using a traditional closer due to their self-imposed payroll restraints, but they avoided naming a full-time closer most of the season.
The juiced ball also is a factor. Think about it this way. Closers pitch almost exclusively in high-leveraged situations, so when they give up a homer, it's even more impactful in the end result of the game. Managers don't like to be embarrassed, so if their closer is giving up game-winning homers, they are more likely to change who gets the role. And even these elite closers give up a proportionately higher share of homers than they would have in other years. Josh Hader had elite ratios (2.62 ERA, 0.81 WHIP), but gave up a whopping 15 homers, tied with Edwin Diaz among closers for the most allowed. Eleven pitchers earned 30 or more saves in 2019, and as a group they averaged 7.8 homers allowed.
One factor that could work to halt this trend is the three-batter minimum rule that goes into play in 2020. All pitchers must face either a minimum of three batters or finish a half-inning. A manager can no longer just turn to a specialist for one or two batters to begin the ninth inning, making it more likely a pitcher qualifies for a save, and also more likely that the closer opens the ninth inning.
Given the collapse in saves, does it make sense to de-emphasize the category, even if we don't punt it entirely? Let's look at the top teams in each contest. How did they do in saves?
In the 12-team Online Championship, the lowest save total among the top-20 teams was 73 saves, tied by two teams. Eleven of the top 20 teams reached at least 82 saves (i.e., hitting that 80th percentile). In other words, these teams did not punt saves.
It was a little different in the 15-team Main Event. Three teams in the top 20 had just 57 saves — around the 50th percentile — and one team only had 46 saves. There were two more teams that also fell just short of the 70th percentile. In fairness, it's easier (relatively!) to pull off a top-20 finish in the Main, with roughly one-fourth the number of teams competing. Finally, in TGFBI, nine of the top-20 overall teams fell below the 70th percentile of saves (69 saves), including the overall winner — Todd Zola had 61 saves.
As always, playing in a stand-alone league as compared to these overall contests opens more pathways to winning — you can flat-out punt a category, which you can't do here. And more often than not, those stand-alone leagues will also allow trading, which creates more avenues for alternate draft strategies.