


This article is part of our Rounding Third series.
A week ago I blogged about the ever-rising home run environment in baseball this season and its fantasy implications. At that point, Major League Baseball was averaging 1.31 homers per game, which easily eclipsed the previous record set in 2017 (by a wide margin!) of 1.26 homers per game. That was as of Wednesday morning last week. Guess what – as you can tell from RotoWire's new League Stats page, that average is now up to 1.33 homers per game!
This is one of many new pages our developers have added to aid you in your fantasy baseball research. I love looking at the global stats in the game to get a good idea of what targets we need, and what sort of game that we're playing. Right now the stats date to 2013, to give you some sort of global context, and you can display either averages or totals, both for hitting and pitching, and you can display for all of MLB, or just for AL or NL if you so desire.
Here are a few other interesting tidbits from the global stats page:
- Stolen bases aren't at an all-time low, but at 0.51 steals per game, they remain at the same low level that they were at last season. It remains as low as it's been since Major League Baseball expanded to 30 teams.
- Strikeouts remain on an unrelenting climb. At 8.82 team strikeouts per game, we're not just at another all-time high, we're blowing away
A week ago I blogged about the ever-rising home run environment in baseball this season and its fantasy implications. At that point, Major League Baseball was averaging 1.31 homers per game, which easily eclipsed the previous record set in 2017 (by a wide margin!) of 1.26 homers per game. That was as of Wednesday morning last week. Guess what – as you can tell from RotoWire's new League Stats page, that average is now up to 1.33 homers per game!
This is one of many new pages our developers have added to aid you in your fantasy baseball research. I love looking at the global stats in the game to get a good idea of what targets we need, and what sort of game that we're playing. Right now the stats date to 2013, to give you some sort of global context, and you can display either averages or totals, both for hitting and pitching, and you can display for all of MLB, or just for AL or NL if you so desire.
Here are a few other interesting tidbits from the global stats page:
- Stolen bases aren't at an all-time low, but at 0.51 steals per game, they remain at the same low level that they were at last season. It remains as low as it's been since Major League Baseball expanded to 30 teams.
- Strikeouts remain on an unrelenting climb. At 8.82 team strikeouts per game, we're not just at another all-time high, we're blowing away the previous high (last year, at 8.49 per game), and we've been climbing every single season since 2008.
- It shouldn't surprise you that batting average are thus down, at .245 per team, which is as low as it's been in the 30-team era. Concomitant with that is the death of the single, something that Joe Sheehan has been writing about for a while now, including at the beginning of this season. Singles are down to 5.03 per game, down from 5.42 last season.
- Even with the high strikeout rates and the low batting averages, each night is a Pitcher Disaster Night. Team ERA's are up to 4.38, from 4.15 last season, and more comparable to the league-wide 4.36 mark of the juiced-ball 2017 season.
This is my favorite of our new stat pages – though if you're a Chris Sale owner you're probably not too happy to see your fears confirmed. Do you want to get a quick snapshot of which starting pitchers are gaining (or losing) velocity? Or maybe you're afraid that Aroldis Chapman has lost some velocity but you want to see just how much? I love that this is fully sortable and searchable.
When looking for 2019 starting pitcher changes, for me the best way to do a quick overview is to click on the "2019" column so that "SP" appears at the top, and you can see the velocity changes. If you want to see the biggest fallers, first sort by "Change" so that the negative changes show up in ascending order, then click on "2019" to show SP first. You'll note that we have a column asking whether there was a Role Change – that's because a pitcher moving from the rotation to relief will throw harder and vice-versa.
Here are the biggest velocity losers among starting pitchers, with those having started at least four games:
| PITCHER | CHANGE |
|---|---|
| Marco Gonzales | -2.2 |
| Chris Sale | -2.2 |
| Joe Musgrove | -2.2 |
| Chris Archer | -1.8 |
| Ross Stripling* | -1.7 |
| Reynaldo Lopez | -1.6 |
| Felix Pena | -1.6 |
| Robbie Ray | -1.4 |
| Charlie Morton | -1.4 |
| Stephen Strasburg | -1.3 |
Remember when Robbie Ray was throwing with more velocity in spring training? And Luis Castillo (-0.2) was throwing with significantly less velocity? It looks as if we have yet another spring training metric to be more less credulous about when evaluating its probative value for the season.
And here are the biggest velocity gainers among starting pitchers:
| PITCHER | CHANGE |
|---|---|
| Drew Pomeranz | 2.5 |
| Jack Flaherty | 1.3 |
| Zack Wheeler | 1.2 |
| Pablo Lopez | 1.2 |
| Freddy Peralta | 1.2 |
| David Hess | 1.2 |
| Vince Velasquez | 1.1 |
| Jake Odorizzi | 1.0 |
| Andrew Cashner | 0.9 |
You'll notice that the extent of the gains are smaller than those of the losses, and that both the gains and losses are flatter than they were after the first one or two starts. That makes plenty of sense – both from a statistical standpoint (sample size) as well as a chronological standpoint. It's early, it's colder, and as much as spring training is designed to get pitchers up to speed, often some pitchers don't hit their stride until later in the season. That's especially true with power pitchers.
Do you want to identify some hitters making the leap in terms of their batting eye? I find it especially helpful when seeing who is striking out less. It's not a perfect predictor of success, but take a look at those who are striking out significantly less often and you'll see a pretty healthy breakout list:
| HITTER | CHANGE |
|---|---|
| Mike Zunino | -13.8 |
| Matt Chapman | -13.5 |
| Chad Pinder | -13.4 |
| Christian Walker | -12.8 |
| Cody Bellinger | -11.9 |
| Brian Goodwin | -10.8 |
| Alex Gordon | -10.5 |
| Nolan Arenado | -10.0 |
| J.D. Martinez | -9.6 |
| Austin Barnes | -9.4 |
| Cesar Hernandez | -8.8 |
| Yoan Moncada | -8.7 |
| Tommy La Stella | -8.5 |
| Hunter Dozier | -8.3 |
Keep in mind that we're in a season where strikeouts are way *up* – yet these guys are putting the ball in play considerably more often. In a lively ball time, that's undeniably a good thing. Perhaps they can't sustain the rate of their breakout or even their improvement in their strikeout rate, but you have to be encouraged to see Walker, Moncada and Dozier on this list. and maybe there's something to the good starts for Goodwin and La Stella?
You saw the good, now see the ugly – these are our hitters who are striking out more often by a large margin:
| HITTER | CHANGE |
|---|---|
| Brandon Drury | 15.0 |
| Victor Robles | 14.3 |
| Travis Shaw | 13.8 |
| Jose Peraza | 13.3 |
| Mallex Smith | 12.1 |
| Curtis Granderson | 11.4 |
| Brandon Nimmo | 11.3 |
| Jorge Soler | 11.0 |
| Joey Votto | 10.8 |
| Danny Jansen | 10.7 |
| Jay Bruce | 10.3 |
There are some scary trends here. Not only is Jose Peraza striking out more, he also hasn't walked since September, entering Tuesday's play with a 0:16 BB:K. Joey Votto is both striking out way more often and walking far less frequently (-7.9 drop in his walk rate), though he walked three times Tuesday night against the Braves, which isn't reflected in the stats yet. Poor Brandon Drury won't be there to kick around much longer, at least.
Do you want to know how your hot starter is stacking up against the rest of the league? Who has been more valuable so far, Cody Bellinger or Christian Yelich? You can check out our Earned Auction Values page to get that answer. One neat feature of this page is that you can customize this page to fit your league specs. Does your league use holds (Shame! Shame! Shame!)? OK, fine, you can account for that. Do you want to adjust how much your league spends on hitting as a whole? You can change that, and you can also adjust the league size.
Setting the auction budget split at 63-37, in a standard 15-team league (mirroring the NFBC Main Event) here's the answer to our Bellinger vs. Yelich question:
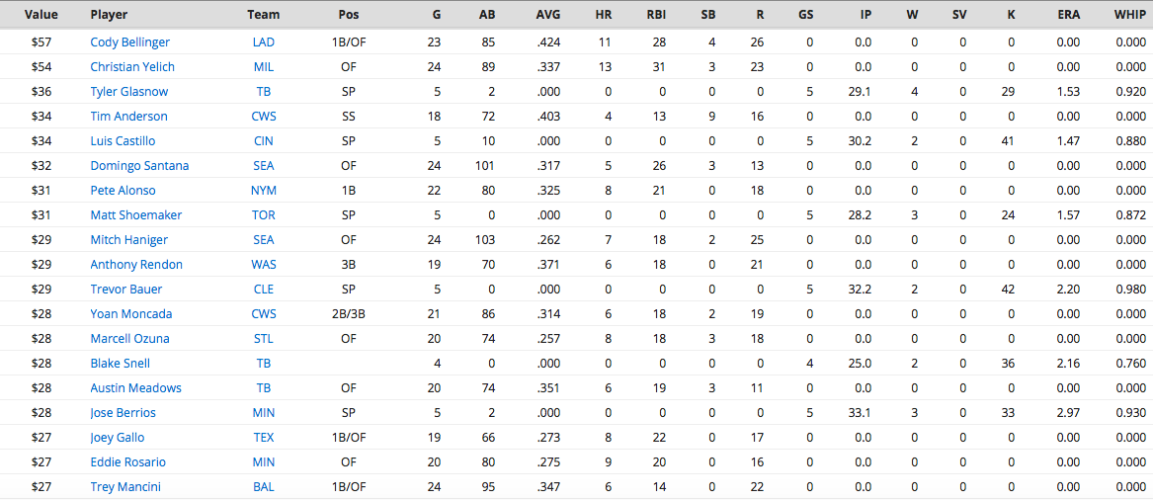
It's Bellinger by a hair over Yelich, and by a lot over the field. The hitter/pitcher split is important to note here. If you switch it to 50-50 to mirror the value of the categories instead of the league context valuation, Tyler Glasnow is actually worth more than either hitter.
If you can find out who the home plate umpire is on a given night, you can give yourself a little bit of an edge by scouting their tendencies. If you see that Clint Fagan (11.58 R/9) or Dale Scott (10.85 R/9) is behind the plate in a given game, you can resolve a 50-50 call in favor of a hitter in the lineup in that game that day. Conversely, if you get a rare game where Nick Mahrley (19.29 K/9) or Roberto Ortiz (18.89 K/9) is calling balls-and-strikes, run, don't walk, to get the starting pitcher in your DFS contest going. The only problem that I've found with utilizing umpire data is finding out who is going to be behind the dish on a given night, *especially* for the opening game of a series. That data often doesn't come out very early, at least in my experience. If you're in the middle of the series it's a lot easier – whoever was at first base the night before moves behind the plate. If you check out the GameCast page on ESPN.com, or the boxscores on MLB.com, you can see who the umpires were for the previous game.
This is just a sampling of some of the new tools you can use on the site. Please chime in the comments if there's a new tool that's giving you an edge, or if there's a tool that you'd like to see. I can see if our developers can build that page.